
Sunshine Coast Council’s updated flood mapping means landowners and homeowners for the first time will be able to view and understand the degree of risk to individual properties.
In the past, they have only been able to find out whether their property was included in, or excluded from, a flood area in the region.
With storm season here, a council spokesperson said the updated flood mapping also would enable the community and industry professionals to make informed decisions to prepare for emergencies, and for land use planning purposes, with the best available, most up-to-date flood-related information.
All the current flood-mapping products are available in one place, presented through the council’s MyMaps platform. Help with using and understanding the flood maps, including factsheets, FAQs and how-to videos, is available via sunshinecoast.qld.gov.au/floodmapping
The council has a range of flood mapping products which can be divided into two main categories: Emergency Preparedness Flood Mapping and Land Use Planning Flood Mapping.
These products have been created using information from numderous flood study and master drainage study reports.
These reports form the basis of the council’s General Information Flood Mapping Layers.
It is expected these flood study reports and the associated online mapping within the General Information Flood Mapping Layers will be of most interest to consultants undertaking investigations on behalf of developers, and may be referred to by the council’s own development services staff as part of the development application assessment process.
Some of the updated flood maps are completely new products available to the community.
| Type of Flood Map | Map Name | Updated | Last updated |
| Emergency Preparedness | Riverine Flood Maps
Minor, Moderate, Major, Extreme |
2021 | 2013/14 |
| Storm Tide Maps | 2021 | 2013/14 | |
| Land Use Planning | Flood Risk Map | 2021 | NEW |
| Define Flood Event Map | 2021 | 2017
2010 Planning Scheme Map |
|
| Flood Storage Preservation Area Map | 2021 | NEW | |
| Proposed Flood Hazard Area for Building Regulation Purposes Map | 2021 | 2010 Planning Scheme Map | |
| General Information Flood Layers
|
Flood Study
· Flood Extent /Hazard · Likelihoods |
2021 | NEW |
The latest changes include:
- updated data in existing maps
- new user-friendly maps and information
- new data made available for the public to inform development applications
- expanded coverage of mapping, extending up some smaller waterways previously not mapped
- mapping in urban areas, showing road flooding that can occur.
Since some of the mapping is completely new, it is not possible to show like-for-like, before-and-after comparison of the mapping. However, to understand some of the changes, the updated Defined Flood Event Map can be compared with the existing Planning Scheme Flood Hazard Overlay Map. This shows that:
- 9% (10,082) of all Sunshine Coast properties are affected at the centre of the property by regional (riverine, creek or storm tide) flooding or overland flow flooding, according to the updated Defined Flood Event Map
- 15.5% (17,202) of all Coast properties are included in the existing Planning Scheme Flood Hazard Overlay Map
- This is because the existing Planning Scheme Flood Hazard Overlay Map is based on a 1.1m climate change allowance, which the council adopted in 2010 when the map was prepared. The updated Defined Flood Event Map allows for a 20% increase in rainfall intensity and 0.8m sea level rise, in line with State Government guidance for planning scheme requirements.
The council spokesperson said most of the changes had occurred in rural areas.
Some of the changes related to areas which were not included in the existing Planning Scheme Flood Hazard Overlay Map for planning reasons.
For example, Caloundra South was not included as the planning scheme flood overlay didn’t apply because the development assessment of that area is managed by the State Government.
Main changes and/or additions to the flood mapping and information include:
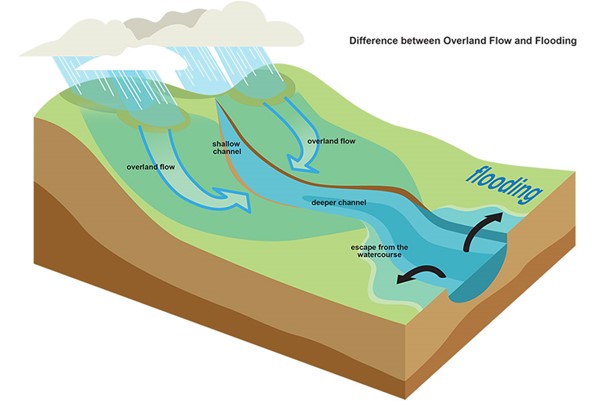
- newly mapped overland flow path information
- newly mapped Master Drainage Study information that provides enhanced details of inundation that may occur in the road network
- creation of a new Flood Risk map. This risk-based approach will inform the development of the Flood Hazard Overlay Map in the new Sunshine Coast Council Planning Scheme.
The updated flood mapping and information are in response to the 2012 Queensland Floods Commission of Inquiry’s recommendation that local governments provide risk-based mapping so residents, professionals and local government can more clearly know, prepare for and manage flood risk.
The council spokesperson said the mapping simply made the flood risk better known to people.
“When people understand the risk, they can make informed decisions – to help prepare for possible emergencies, or to know how to use their land when considering development or building works,” they said.
The council website says up-to-date flood information helps residents understand how flooding and overland flow may affect aspects of their everyday life.
Residents are encouraged to look at locations where they live, where they work, or where their friends and family may go to school, and look at how flooding affects the routes they often travel in the event a back-up plan is needed.
As well as preparing for emergencies, the website says the information could be of use in:
- education and insurance
- land use management and planning
- infrastructure
- building controls
- coastal management
- structural works
- landscape and environment.
Considering how a property is affected by flooding and overland flow early in the planning phase helps ensure design solutions are identified to avoid or work around flooding and overland flow challenges.
It also avoids potential problems such as rectification works needing to occur after construction, or legal disputes between neighbours if an overland flow path becomes blocked.

Environment and Liveability Portfolio Councillor Maria Suarez said living with flooding was a natural part of life on the Sunshine Coast and across much of Queensland.
“We can’t prevent floods from happening, but we can take steps to reduce the impact of floods by understanding our flood risk,” Cr Suarez said.
“Having access to up to date flood mapping and information is a key way for us to do that. It enables the community, and industry professionals, to make informed decisions to manage potential risks and build our region’s resilience.
“Council has a range of flood mapping products to inform emergency preparedness and land use planning.
“Over the next few months, we’ll be working closely with our community to ensure the flood mapping and accompanying information is made available in an easy-to-use format. Several maps will be made available to suit a range of uses.
“It’s important to understand what each map is intended for, and what is being presented.
“We want to make sure the people who view and use these maps, can understand and access each product with ease.”
The council is seeking feedback on how easy its flood mapping and information is to understand and navigate. Visit the council website and provide feedback in a short survey before October 31.
